Regatta Tips & Tricks
Winning in the Whitsundays
The Whitsunday Islands provide some of the best sailing conditions in the world. The warm weather is attractive to all, especially those escaping from a cold southern Australian winter. Add to this, competitive fleets, strong tides, all manner of winds and you also have one of the most challenging places to sail and race well.
This blog discusses navigation tips and tricks specifically related to sailing in the Whitsundays and racing at Airlie Beach and Hamilton Island Race Weeks.
As always, a good place to start your preparation is with the Notice of Race and the Sailing Instructions. These documents outline the area of racing, the electronic (or paper) charts required and the scheduled days for racing. The documents also list the rules that apply for each regatta. The business end of both regattas is raced under the IRC rule.
KNOW THE RULES: IRC crew restrictions
One rule applying to ALL Australian IRC regattas which does not appear to be both well-known and adhered to, is the restriction on crew changes. IRC rule 11.1 allows a rule authority, in our case Australian Sailing (AS), to modify some IRC rules. It seems all IRC boats in Australia know they can carry an extra spinnaker when racing in a cat 3 or higher race. This is an AS prescription. What is less well known is that “Australian Sailing prescribes that during a regatta run on consecutive days, including any lay days, the crew shall remain the same and be on board for all races. Exceptionally, crew may be replaced with the permission of the Race Committee.”
Fundamental Navigation
The first job as the navigator is to make sure you navigate your yacht safely. That means NOT hitting the bottom! This is not as easy a task as it seems, especially when you are racing hard, looking for any gains and under pressure from the crew. The charts are not always accurate, especially close to shore around the islands and, with plenty of coral bommies around, depths can go from 12m to less than 2m in a matter of metres. Prior planning and preparation can help avoid problems. First, make sure you have the most up to date paper and electronic charts. Next, make sure you have a copy of the Whitsunday Islands Cruising Guide: 100 Magic Miles by David Colfelt. Determine the tide times for Shute Harbour for the period of the regatta. Examine the predicted tide time differences for secondary ports in the Whitsundays. For example, the tide turns 24 minutes earlier at Hayman Island and high tide is 6 minutes later at Lindeman Island. Make note of the tidal heights for each race.
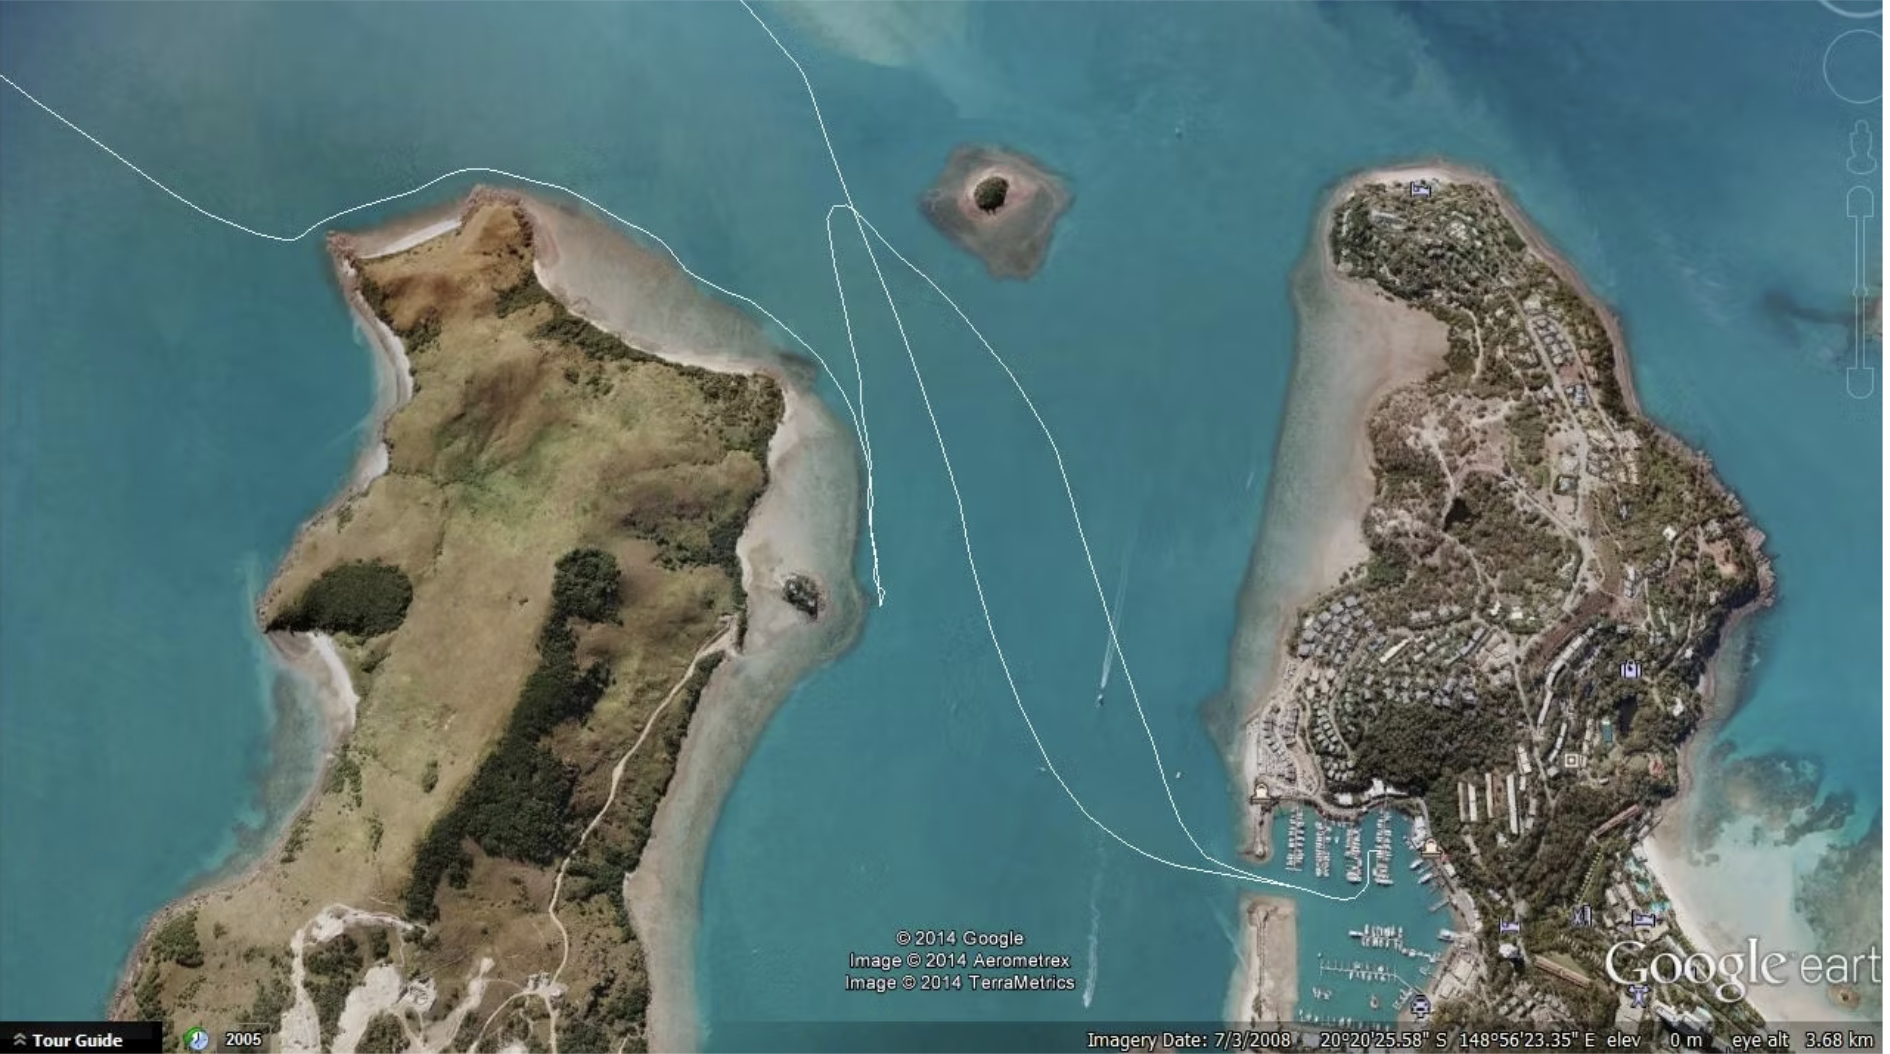
Google Earth is a very useful tool for racing and sailing around the Whitsundays. It has a series of very high resolution geo-referenced aerial photographs and these are superb for spotting the fringing reefs and other dangers around the islands. The software program Expedition has a great feature which allows you to export your track to a KML file and this file can be imported directly into Google Earth. For those who have sailed the race weeks before, or who have some training days scheduled you can upload your tracks to see just how close you are getting to the rocks! You can also survey danger areas before racing and then mark “safe” and “no go” areas on the chart. Figure One shows Hamilton Island and the top of Dent Passage with some Expedition tracks overlaid.
Figure One. Google Earth image of Hamilton Island and Dent passage showing the fringing reefs and an imported Expedition track.
Tidal Currents
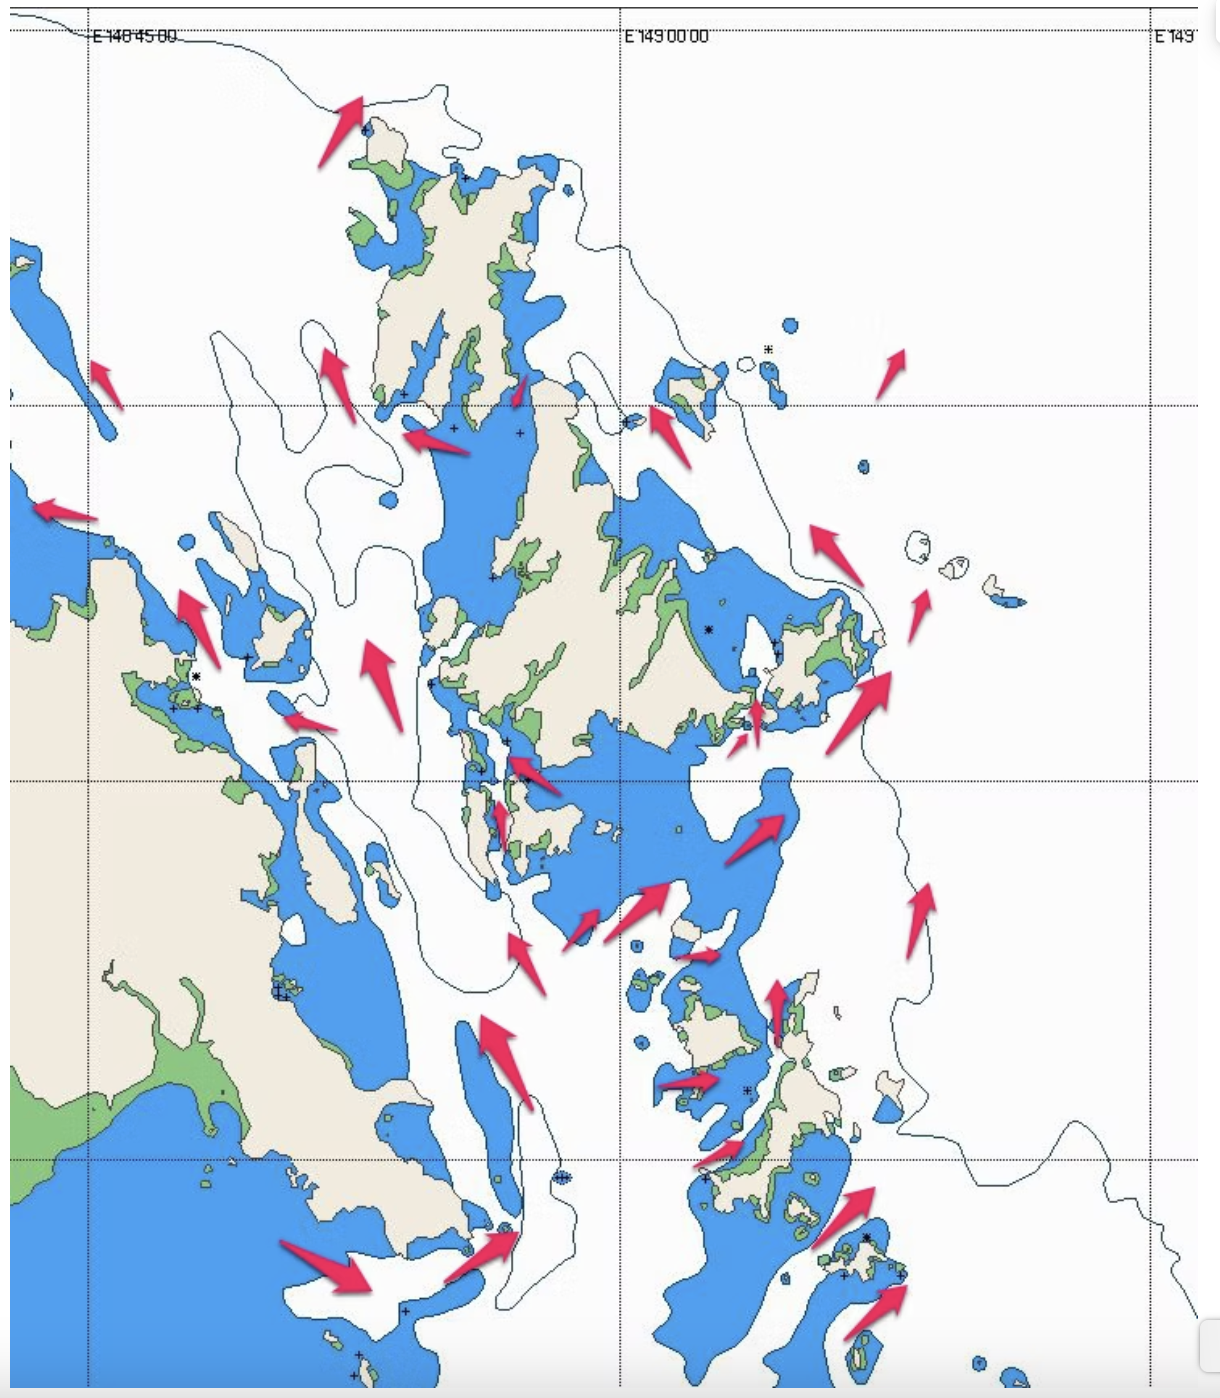
When racing in the Whitsundays, a key part of doing well is a good understanding of the tidal current flows. The general and basic rule for tidal currents here is that they FLOOD south and EBB north. In VERY general terms the rule works for the Whitsunday Passage but of course the system is not quite so straightforward. In this region the flood tide currents flow towards Mackay and into Repulse Bay so, while this flow is to the south in the passage, it is actually flowing to the SE and east around the top of Hamilton Island and SW at the SE corner of Lindeman Island (See Figure Two). On the Ebb tide the reverse occurs (Figure Three).
Figure Two. Predicted FLOOD tidal current directions in the Whitsunday Islands
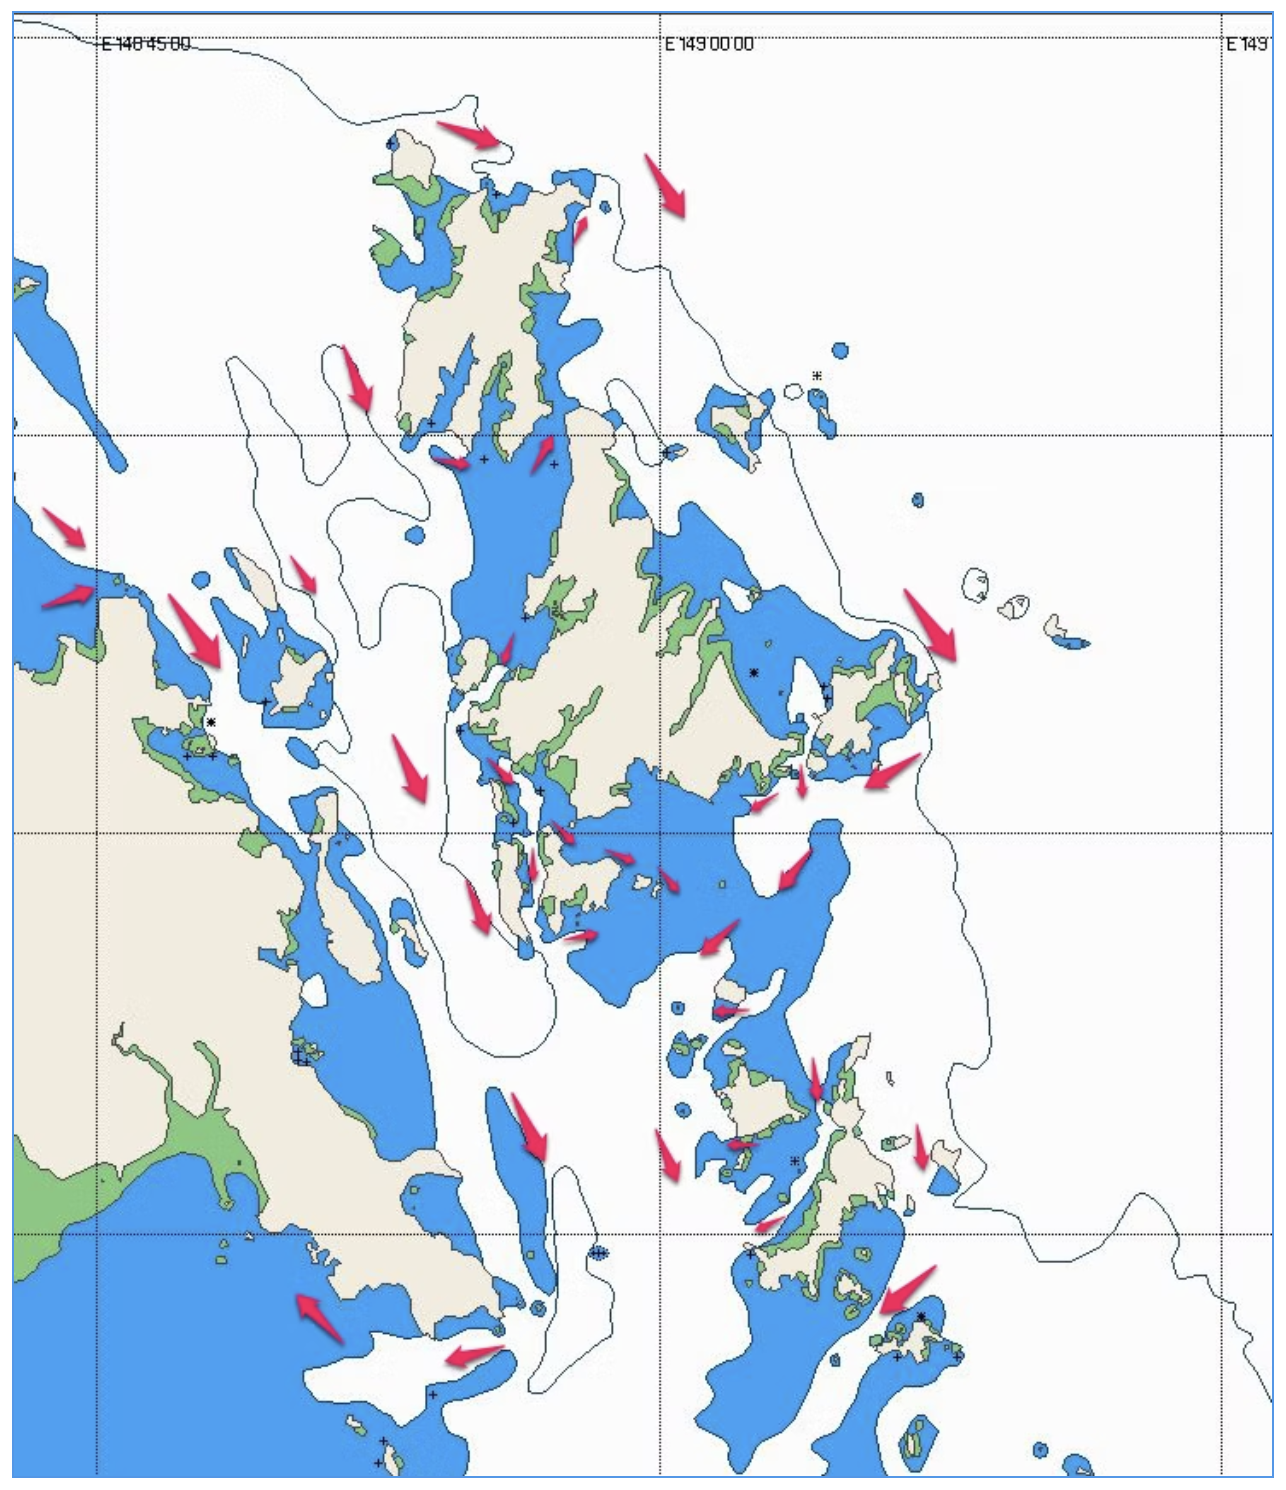
Figure Three. Predicted EBB tide current directions in the Whitsunday Islands.
Some general rules are listed below. Remembering these basic rules will help in building a better understanding of expected tidal flow and inform the tactical decision making process.
1. When the wind blows in a constant direction for a period of time a surface current is created that moves in the general direction the wind is blowing. The tidal currents, occurring with the movement of water between high and low tides, continue but their direction, speed and timing are affected by these wind induced currents. In the Whitsunday region strong steady winds typically come from the E-SSE. In this situation expect the (NNW flowing) ebb tidal currents in the Whitsunday passage to be stronger and longer and the (SSE) flood tidal currents to be weaker and shorter.
2. Tidal currents tend to be weaker in shallow water compared to deep water. This is due to the effects of friction from the sea floor. Therefore when sailing against a tidal current you should look for shallower water for weaker adverse currents. Beware of point 3 though!
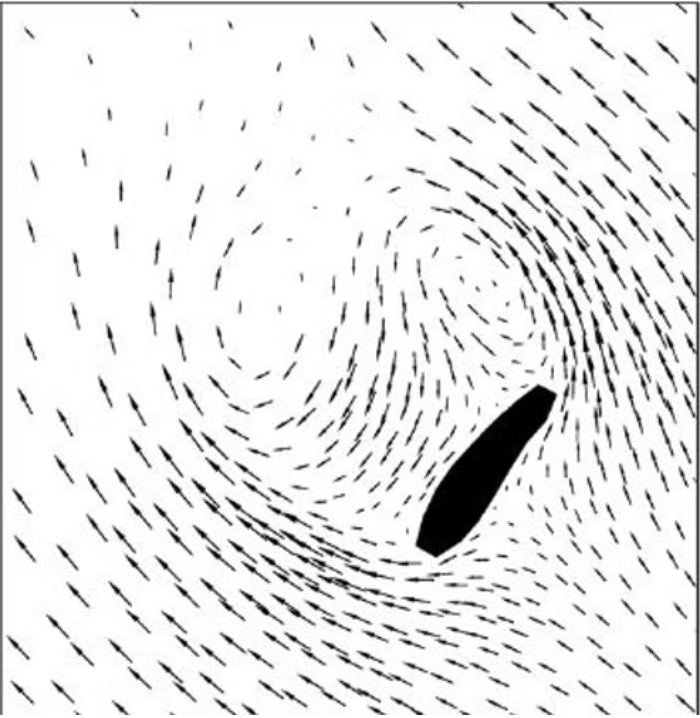
3. The topography of the sea floor has an effect on tidal current flow in much the same way high land affects wind flow. You get acceleration zones, shadows and eddies when the current comes into contact with shallow water, step ledges and land. Figure Four shows the possible effect of a body of land on current flows. In these situations a yacht one boat length inside another can have completely different currents and can easily be 3-4 knots faster over the ground. Getting into these favourable eddies requires excellent knowledge of tidal heights and resulting water depth, and bold navigation.
Figure Four. Predicted ebb tidal current flow around Rattray Island, Whitsundays. This figure is taken from a scientific paper by Lambrechts et al.(2008)[i].
4. Typically tidal currents change first on the edges and especially inshore. If you are sailing against the tidal current near the turn of the tide then look to the edges to get the first favourable tides. Conversely, if you are sailing with the current then you may choose to stay out in the middle to hold onto the last of the favourable current.
High Resolution Weather Models
The high resolution meteorological models get better every year. The 1km Predict Wind models can be helpful in planning your race strategy (Figure Five).
Figure Five. PredictWind (PWE) forecast
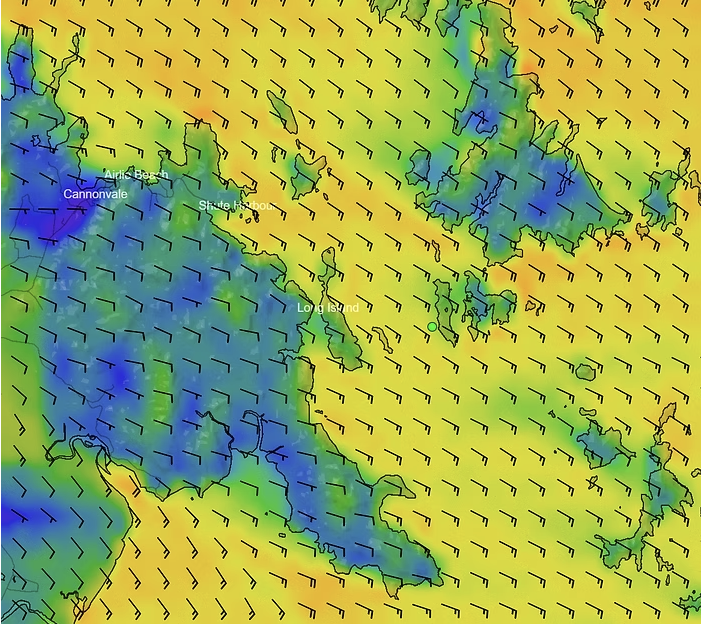
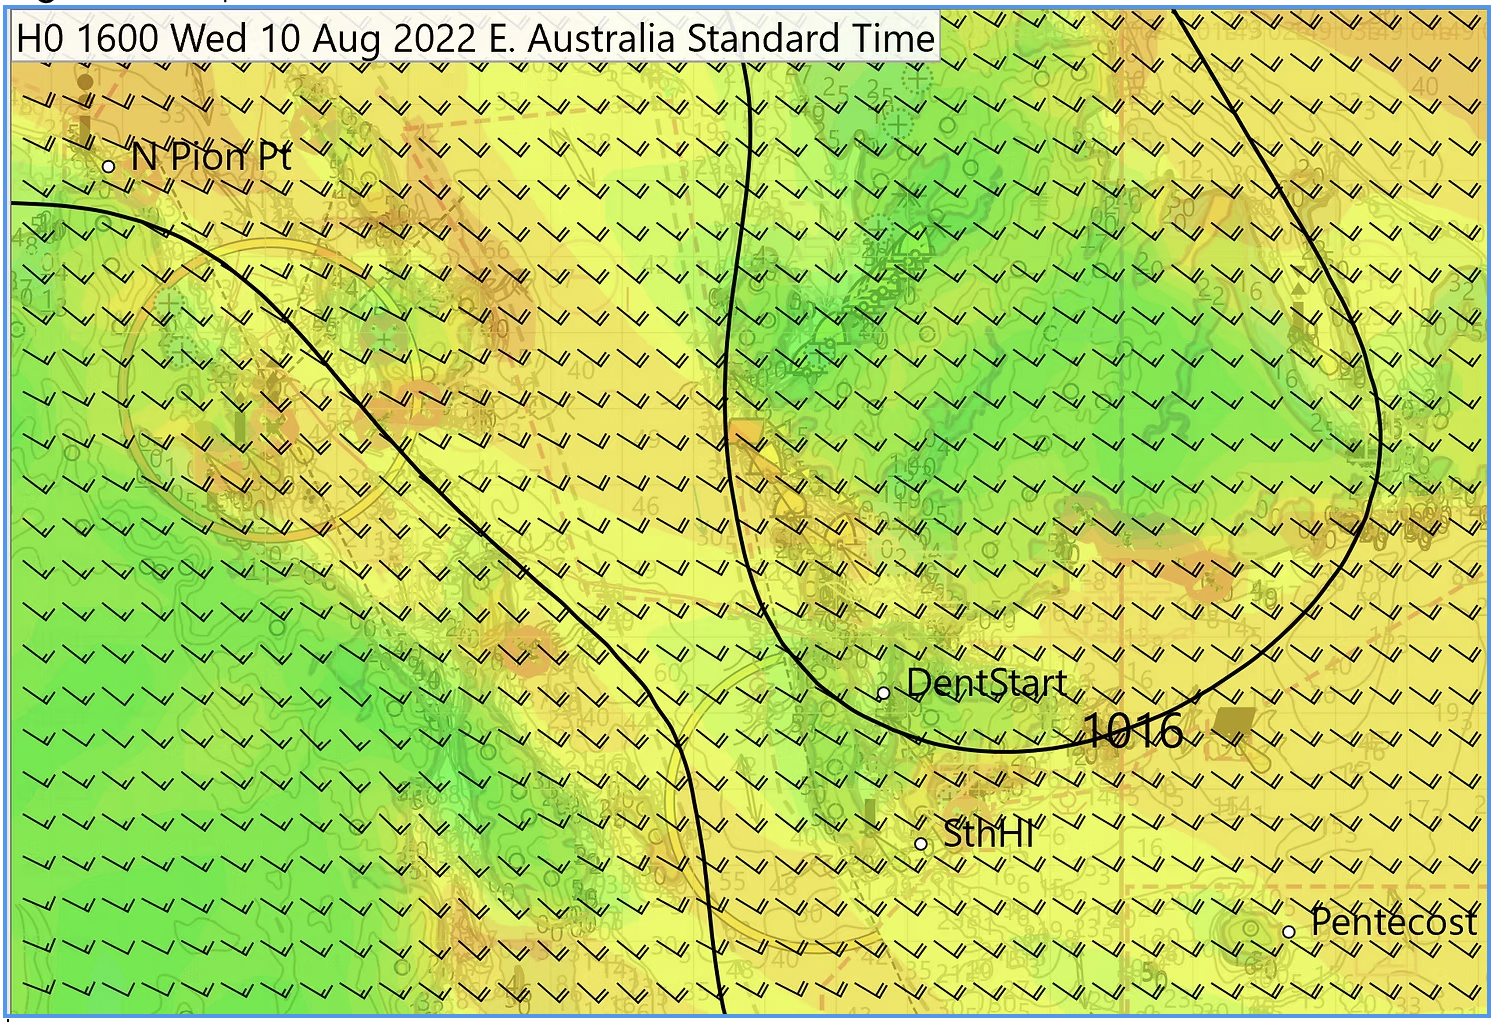
Figure Six. Expedition WRF model
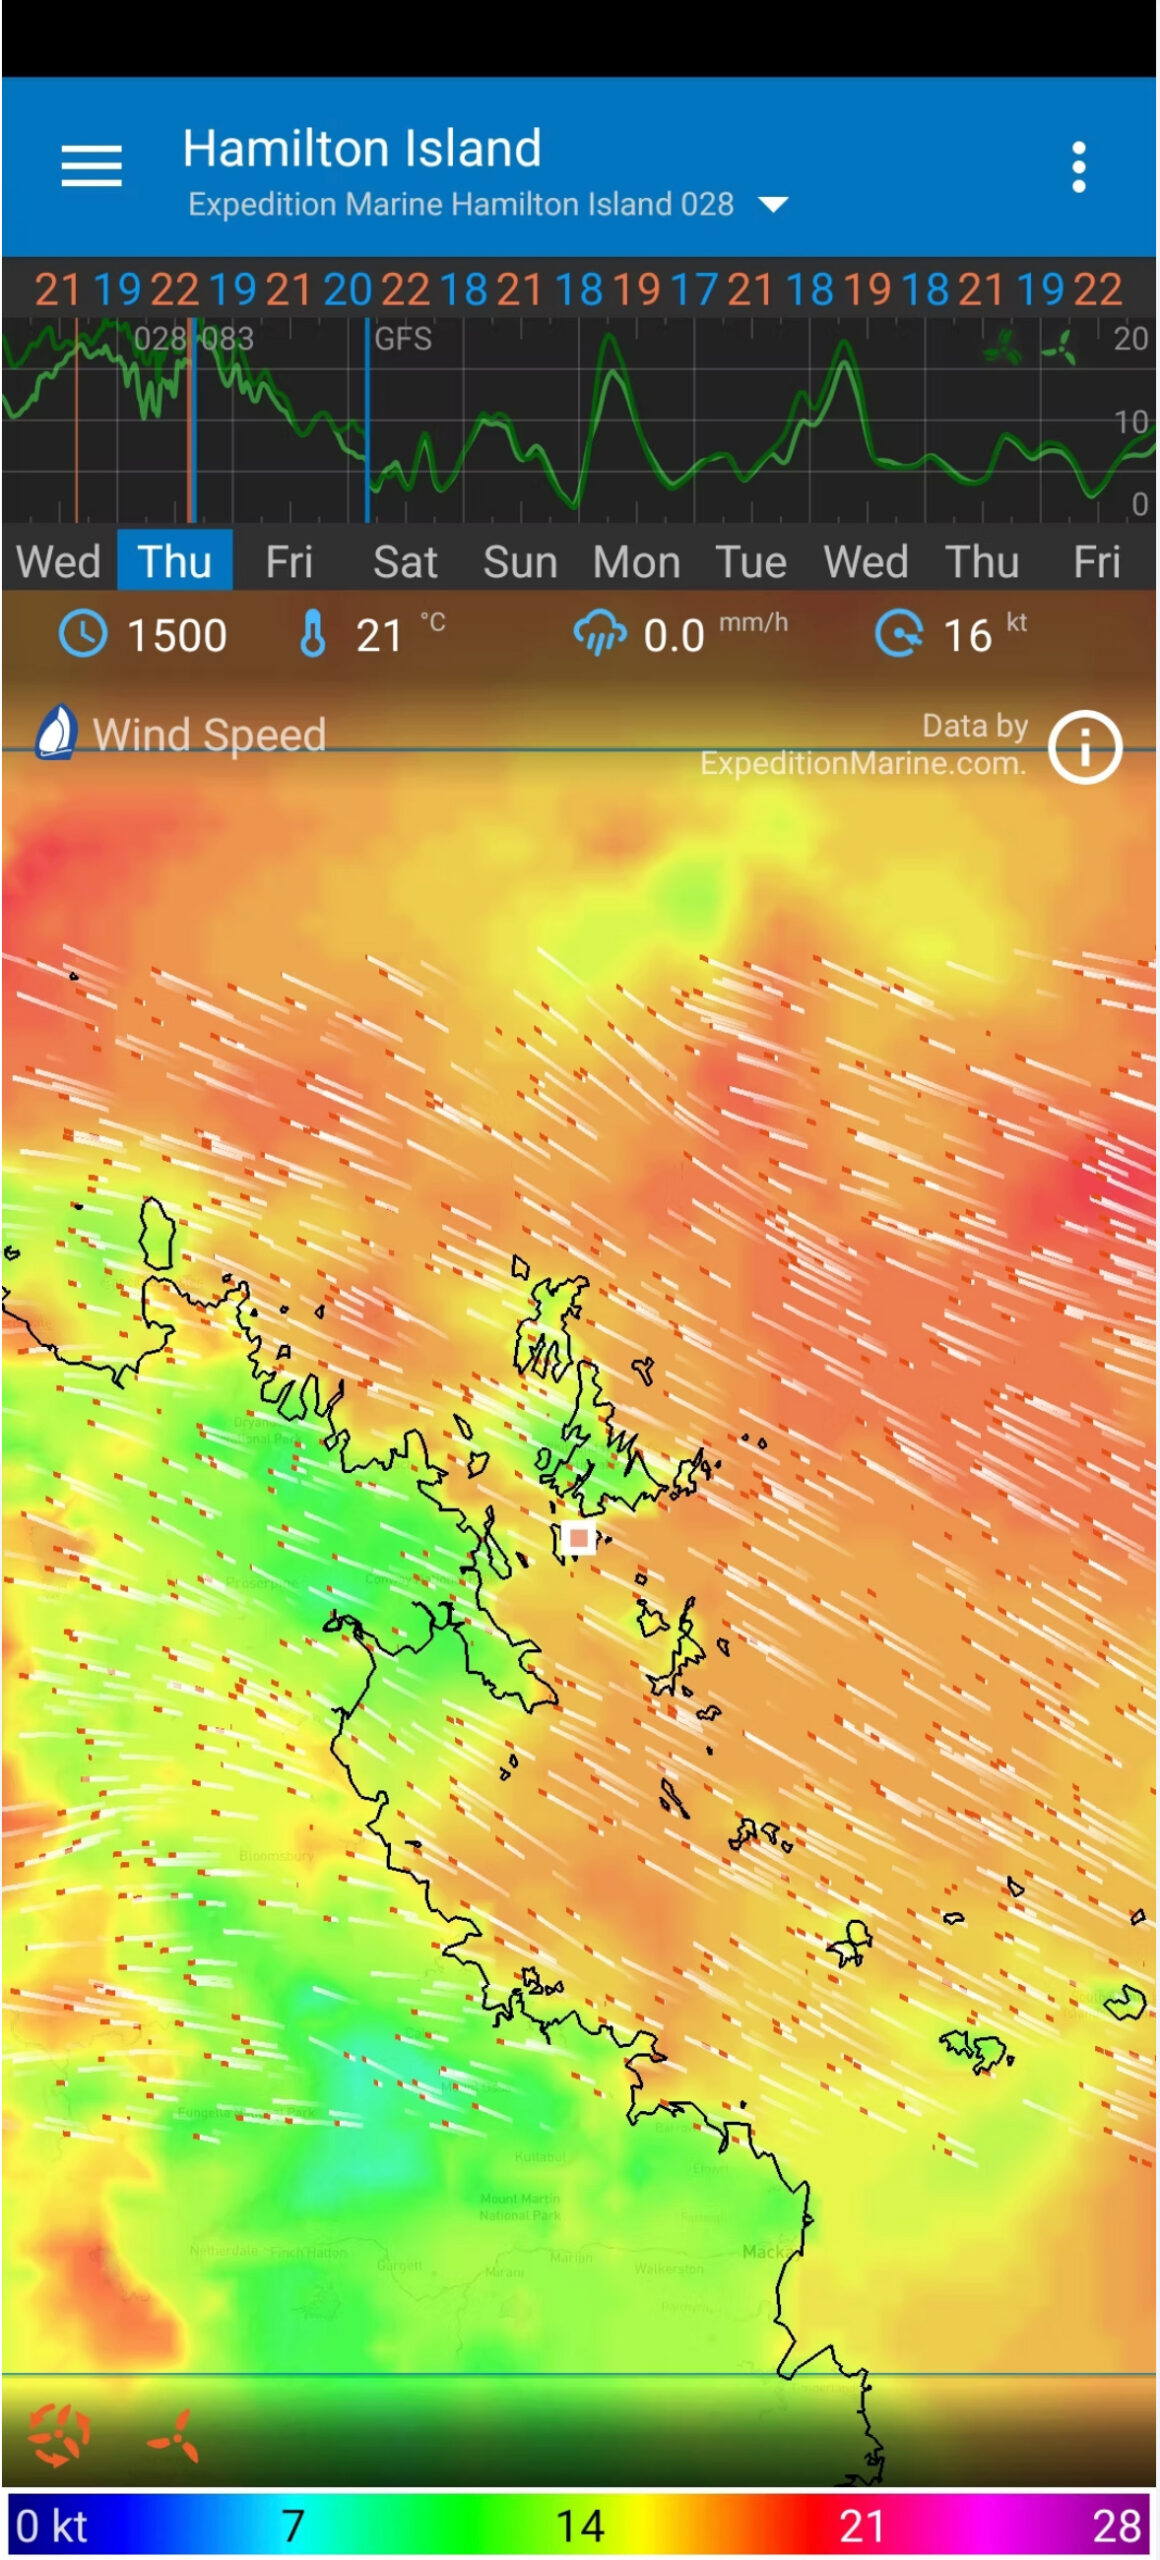
If you do not have Expedition you can also access this model using the Flowx weather app with a Gold subscription (Figure Seven).
Figure Seven. Flow X screen shot.
Effect of tide on wind speed and direction
Often though, the sailing wind direction experienced on board by the crews can be very different than predicted, and many crews invariably blame the model. Sometimes this is reasonable, but often the model is working very well and it is the effect of the tidal currents which explains the discrepancy.
The effect of tidal currents seems to be one of the great misunderstood features of sailing. Every year I still hear people talking about getting the current on the correct side of the keel or on the lee bow to help. It is now my turn to try to explain what is going on. I also refer you to a detailed explanation in Dave Perry’s excellent book “Winning in One-Designs” if you are still not convinced.
The first thing is to conceptualise your boat as a log in a river. The log moves down the river at the same speed irrespective of its orientation. It moves just as fast when orientated sideways as it does longways. If it is dead calm and (for some strange reason) you managed to stand on this log moving down a fast flowing river at 5 knots then you would experience an apparent wind speed of 5 knots up river. So, on a day where the anemometer is not moving (0 knots) at Hamilton Island airport but there is 3 knots of current running south in Dent Passage then you will have a sailing wind of 3 knots from the south. So far so good I hope. Now we need to (re)introduce some year 8 maths in the form of some simple trigonometry. Stick with me! Imagine a situation where the wind reading at Hamilton airport mirrors the wind flowing over Dent Passage. The current is still flowing south at 3 knots. If the wind reading at the airport is an easterly at 4 knots, then the “sailing wind” you will experience is not the 4 knot easterly but instead, 5 knots from 127 degrees (Figure Eight).
Figure Eight. Vector diagram, showing the effect of a three knot southerly tidal current on a four knot easterly (090) wind. The true sailing wind experienced by a vessel underway is five knots from the SE (127 degrees true).
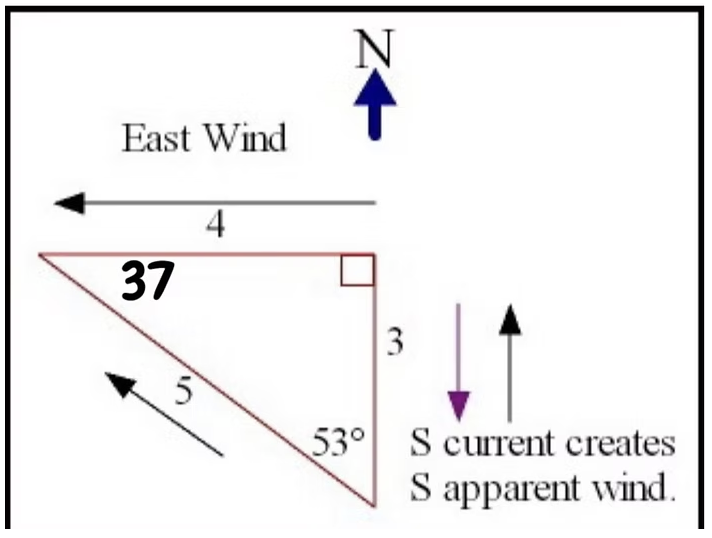
This is a simple example with the actual wind direction nicely at right angles to the current direction. Also, because the current speed was similar to the wind speed, the effect of the current on the sailing wind direction was very large with the wind “dragged” nearly 37 degrees right by the current.
So how is this all useful to you when sailing in areas with tidal currents? An understanding of how the tidal current has affected the wind will allow you to predict what will happen to the sailing wind when the current changes in direction or speed. A simple rule to use is to look directly towards the sailing true wind direction and, if the current is flowing to the right of this, then the current has dragged the actual true wind direction right and visa versa. If the current is flowing towards you a bit then it will also have reduced the sailing wind speed.
Wind Shadows and Acceleration Zones
Most sailors are familiar with acceleration zones where the wind funnels through a narrow gap and is much stronger than the surrounding wind. Funnel Bay, just to the east of Abell and Mandalay Points at the southern end of Pioneer Bay is a good example where bullets of wind routinely flow out of the bay in SE winds (See red arrow in Figure Nine).
Figure Nine. Molle Channel in a SE Wind. The shaded red areas show predicted acceleration zones (from convergence) and the yellow shaded areas show predicted wind shadows. The red arrow shows the accelerated wind flowing out of Funnel Bay.
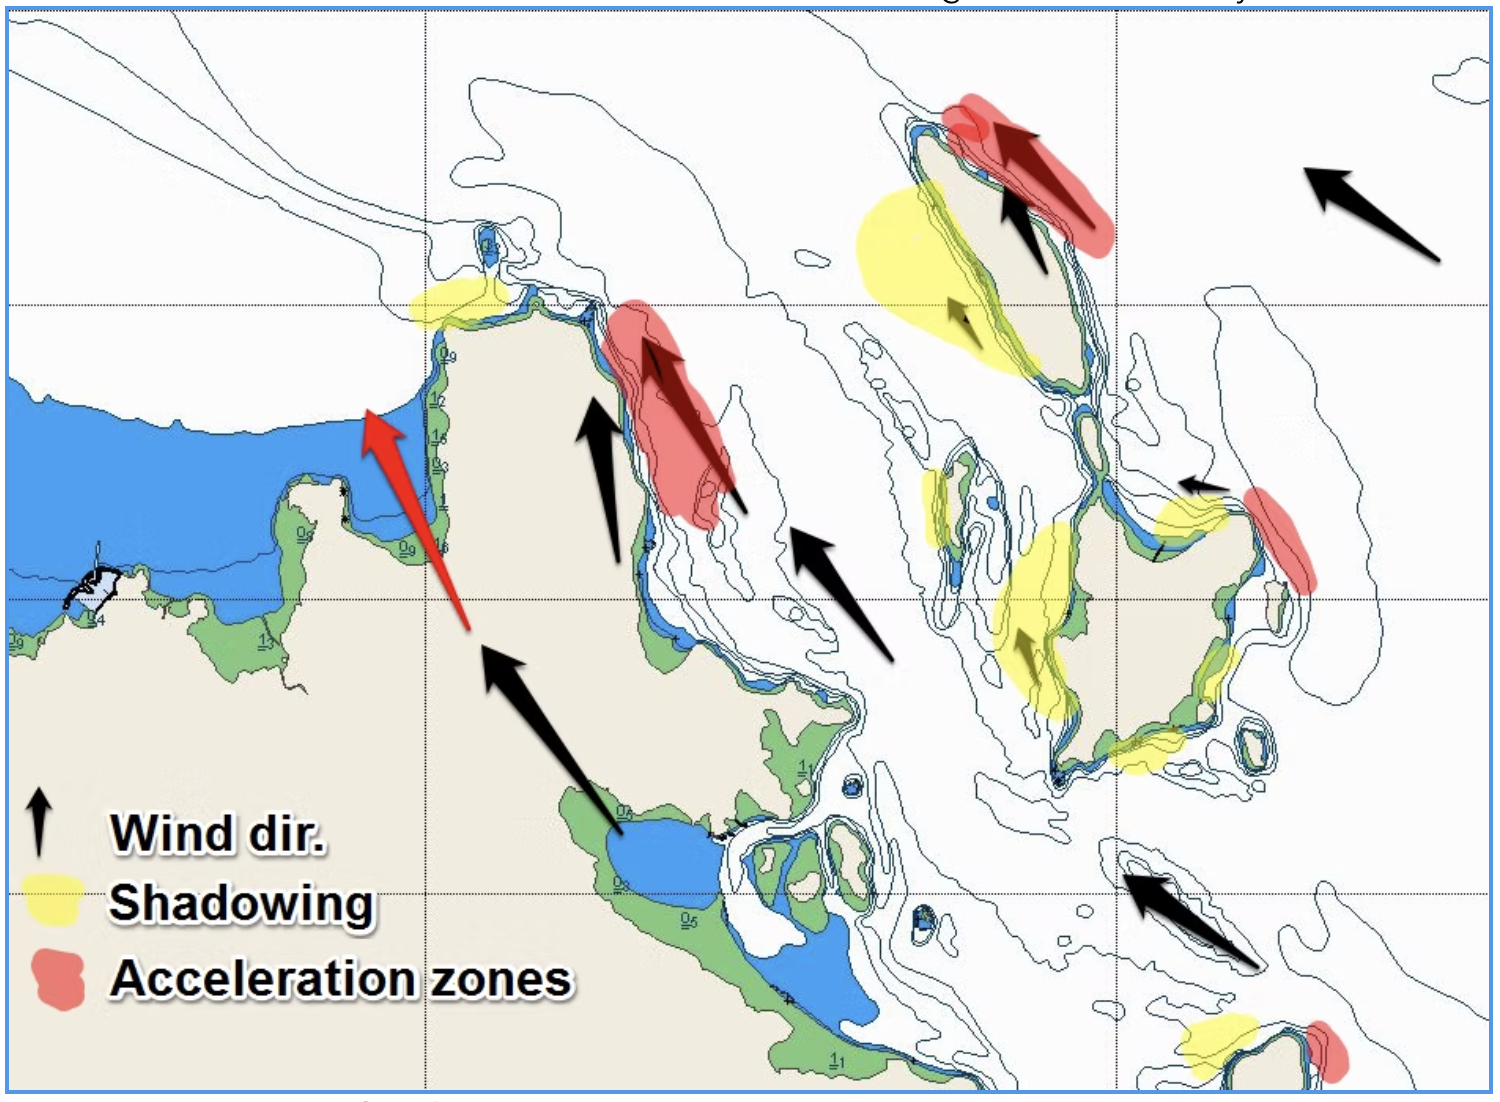
Without going into too much science, in the southern hemisphere the wind aloft tends to be coming from left of the wind we experience on the surface. This is due to friction and coriolis forces. The more friction there is on the surface the more the wind turns to the right. In practise, wind flowing over rough land surfaces rotates further to the right than wind flowing over the water. Figure Nine shows the practical effect of this. With a southerly wind, land to the west of the sea will twist the wind slightly to the right and this will result in the two winds converging. This causes accelerated wind on the waters close to the land.
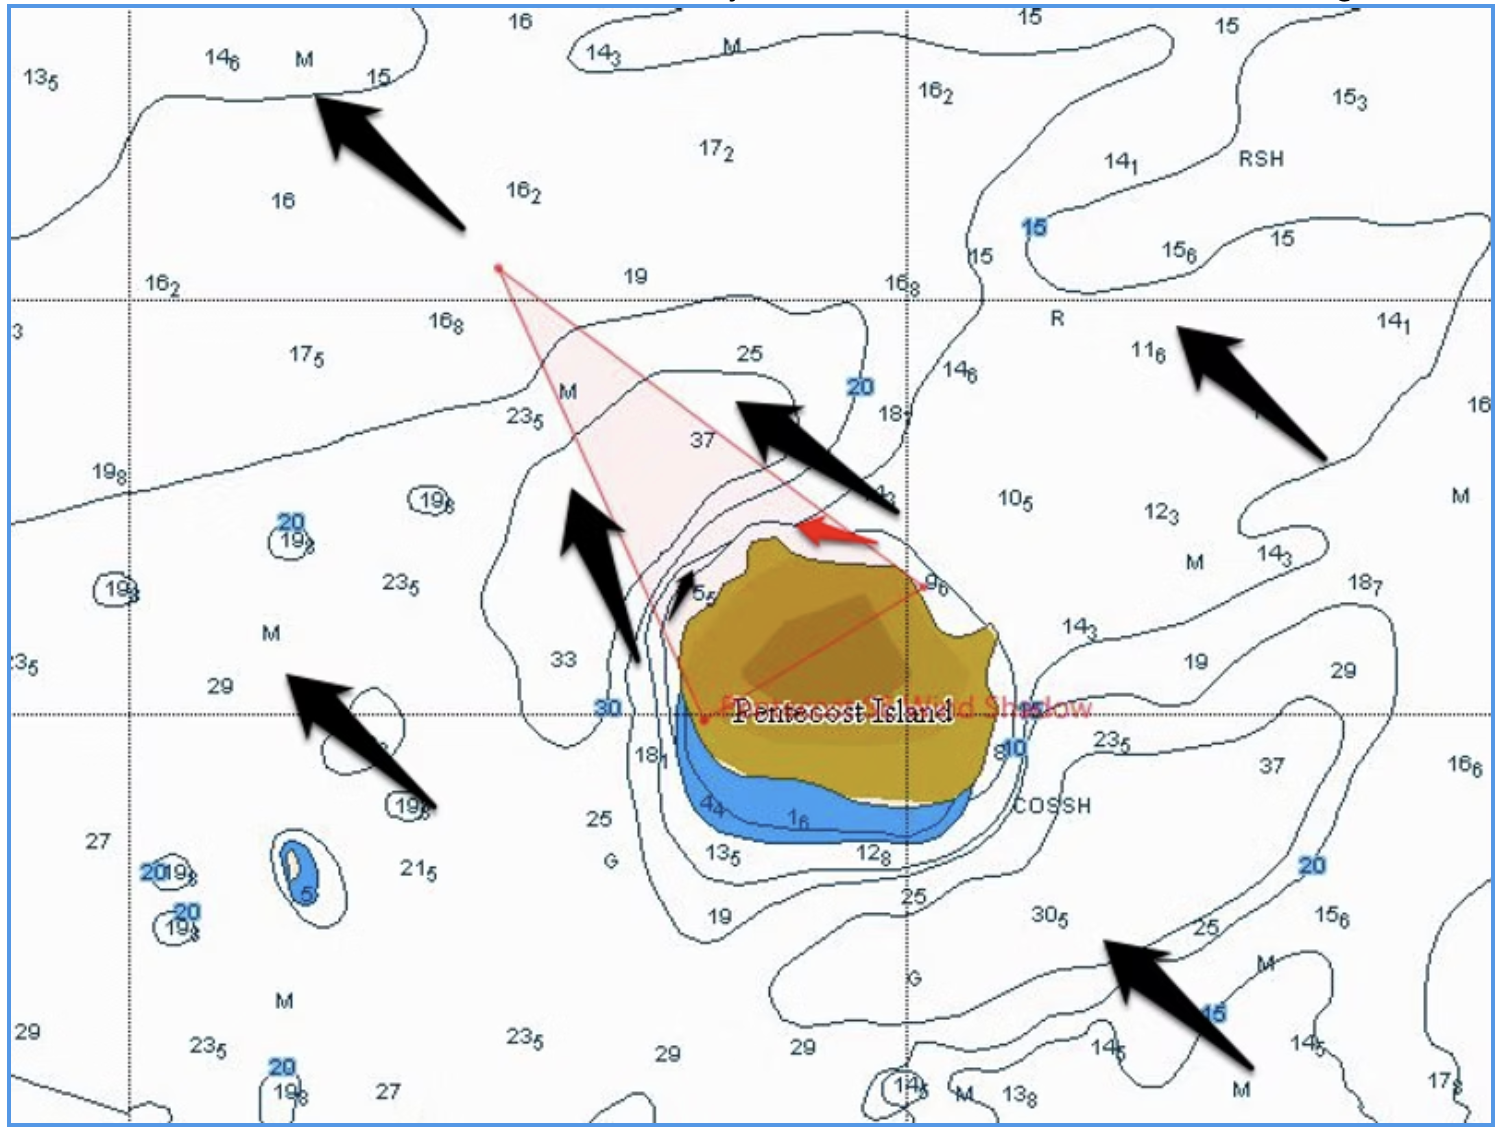
Many of the Whitsunday Islands are high islands casting wind shadows hundreds of metres downwind of them. You can see the impact of wind shadows up to 30 times the height of an island but the worst of the shadow will be likely be experienced at 4-10 times the height of the island. The more stable the wind field, the worse the wind shadow. In August, the average sea temperature is around 25 degrees while the air temperature maximum averages 24 degrees, so there is generally good mixing as the warm water heats the air. Wind shadows are also greater in light wind than heavy wind. It is suggested that you measure out seven times the height of the land on an island then put a mark directly downwind of the expected wind direction. Mark out a triangle from the corners of the high parts of the island to this point. You can do this on the paper chart and, if you use the software programs Expedition or Adrena, you can also do this on your electronic charts.
The islands not only create wind shadows but they can also cause changes in wind direction. A good example of this is Pentecost Island (Figure Ten) where the wind flows around both sides. Looking upwind towards the island you get left shifts on the left hand side of the course and right hand shifts on the right hand side of the course.
Figure Ten. Predicted Wind Shadow for Pentecost Island shown in red. The possible wind directions in a SE wind are also shown. As you get closer to the island the wind rotation will likely be greater but the effects of the wind shadow will also be greater. In this situation you may have to tack onto an unfavoured tack to avoid sailing a lift into a no wind zone. The red arrow indicates that this side of the island may have more wind as a result of convergence.
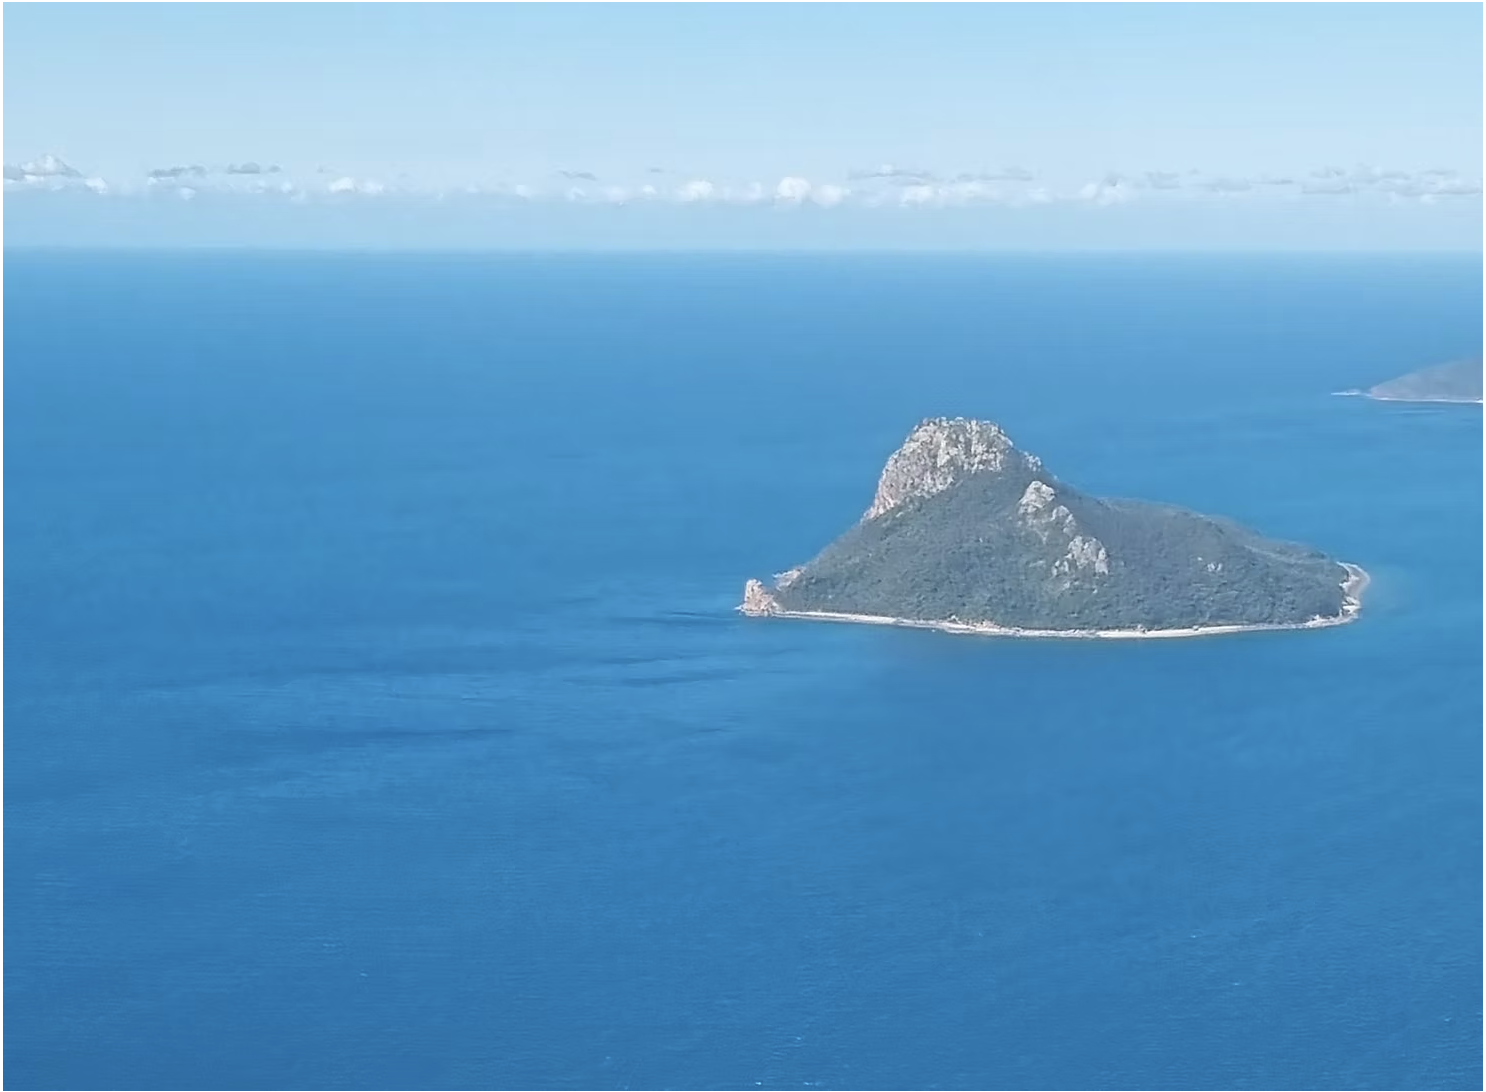
In August 2022 I managed to get a nice aerial shot of Pentecost Island showing the wind shadow. (Figure 11). The photo also shows bands of left shifts feeding in around the eastern (left hand looking upwind) side of the island.
Figure 11. Pentecost Island looking towards the SE in a SE gradient wind.
Summary
I have tried to give you some insight into the complexity of racing around the Whitsunday islands. I have suggested techniques and tips for mapping out the race courses and marking out the expected tidal currents and local wind influences on your chart. Using these notes during racing should greatly improve the odds of your tactical decisions being good ones.
The Whitsunday area has all the tidal complexity of the Solent and racing at Cowes in the UK, mixed with the (usually!) reliable trade winds of Antigua Race Week and the Caribbean. Add to this, the North Queensland winter weather and the Whitsunday Islands really are one of the best places to sail in the world. Enjoy and good luck!
[i] Lambrechts J et al. (2008) A multi-scale model of the hydrodynamics of the whole Great Barrier Reef. Estuarine, Coastal and Shelf Science 79 (2008) 143–151